Features and Technology
Major Features
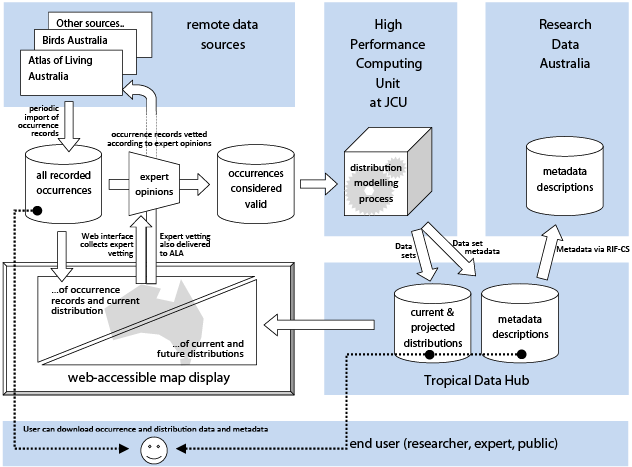
The cornerstone of the user experience is the zoomable, draggable graphical map. This will underpin the experience of birdwatchers looking for distribution maps, the general public looking at the effect of climate change, species experts checking the accuracy of observations, and researchers browsing and selecting datasets to download for their own use.
Most users will be familiar with using a mouse to drag a map around and changing the viewing scale to zoom in and out, from using Google Maps and similar services. Along with these interactions the map will also support a “vetting” interface that permits users to express their confidence in individual observation records.
In addition, the map will support displaying the changes in projected distribution along a future timeline. We expect to use animations to show these changes, whilst still permitting the user to view the projected distribution at specific points on the timeline. Data used to construct the map will be available for the user to download.
Architecture
Technology
This project will use modern web technologies to be delivered in-browser with no software installation imposed onto the user. The system will employ OpenLayers for the map presentation, and JQuery and JQuery UI for other interface elements. Using these libraries help to make the interface operate correctly across a variety of web browsers.
The geospatial elements of the map site is driven by MapServer, with the HTTP level interface delivered by well-known web scripting language PHP, using the CakePHP framework to provide the common MVC abstractions used to develop a robust, maintainable web application.
Data is regularly imported from the Atlas of Living Australia using Python scripts that interact with ALA ‘s web sevices.
The modelling software that turns vetted observations into distributions, and future distributions, is provided by Dr. Jeremy VanDerWal from the Centre for Tropical Biodiversity & Climate Change and uses computing resources from James Cook Univesity’s HPC unit.
Development Effort
As the accuracy of generated distributions depends greatly on clean observation data, encouraging species experts to contribute their opinions on observations is critical. One major area of development effort is the user interface and surrounding system for vettings. The vetting UI must be easily discoverable (because a bird species expert is not necessarily familiar with technology) and low-friction (because people vetting observations are volunteers, and we want to turn every drop of volunteer motivation into a contribution).
The second major area of development effort will be in preparing and displaying observations and distributions. This involves handling large data sets in a way that produces results in interactive time frames. The back end will need to preempt user demand to be able to extract relevant data from storage, and cluster and summarise as necessary to ensure the user is not waiting a long time for data to be displayed in their web browser.
The Source
The project uses a local install of Redmine for project tracking, Jenkins for integration testing, and hosts the source at a github repository.
The source is available under the three-clause BSD licence.
blog comments powered by Disqus
