Edgar User's Guide
Edgar’s Map Modes
Edgar is a web based mapping tool looking at Australia’s birds, and climate change.
Edgar’s main window displays a map, with a species bar across the top, and a selection of tool panels down the right hand side. This map view can be in one of four modes, depending on what you want to do. The modes are:
-
blank mode just shows the map, with no extra information. the only time you see this is when you have just hit Edgar but haven’t loaded a species yet.
-
current mode shows observations as dots, and suitable climate areas as a coloured map overlay, for your selected species.
-
future mode shows suitable climate areas for some year in the future as a coloured map overlay, for your selected species.
-
vetting mode permits logged-in users to improve Edgar’s accuracy by classifying observations.
This document will look at each mode in turn.
Current Mode
Current mode is automatically entered any time you select a new species.
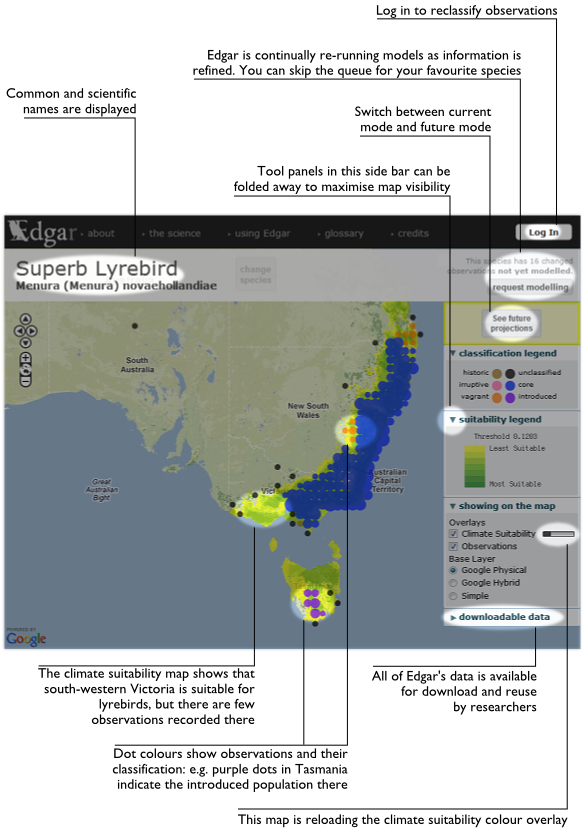
Observations of the species are displayed in this mode as coloured dots. Each dot represents a cluster of observations across a rectangle of Australia. The size of the cluster rectangle changes to suit your current zoom level; as you zoom closer, each cluster dot divides into four dots.
Once you are zoomed in enough, observations are no longer clustered, and are simply drawn precisely where they occurred. Note that a single dot may still represent multiple observations, in cases where multiple observations have identical geographic coordinates.
Edgar categorises observations into several classifications, shown in the ‘classification legend’ on the toolbar down the right side of Edgar’s map. Each cluster dot is coloured according to the most common classification within that cluster.
You can click on a cluster dot to see the breakdown of observation classifications within that cluster, and to see additional detail about each observation such as accuracy, date of record, etc.
Future Mode
Future mode finds areas suitable for the bird in Australia’s projected future climate.
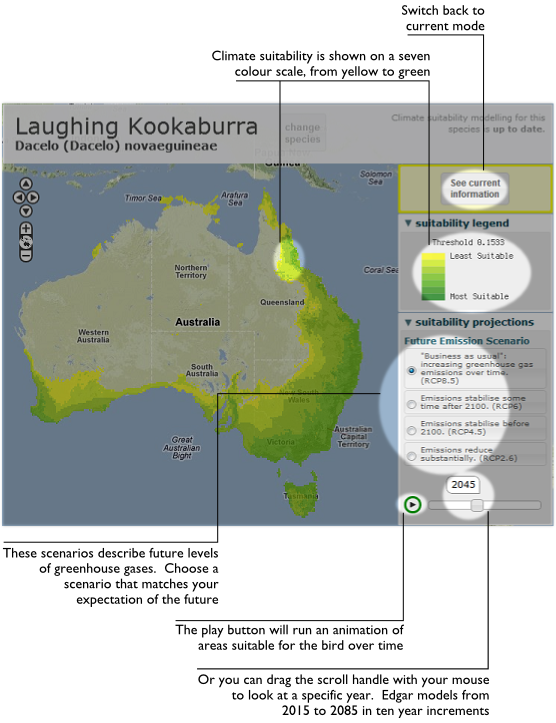
Climate change is affected by the amounts of greenhouse gases in the atmosphere. Therefore, projections of climate are dependent on how you expect greenhouse gas concentrations to change in the future. The IPCC has defined four different pathways for gas concentrations, each representing a more or less optimistic view of the future. These four pathways are called Representative Concentration Pathways, or RCPs.
Edgar models climate suitability for a species in each of the four RCPs. Edgar runs 18 different climate models and uses median values across all models to obtain climate projections.
Climate suitability is shown on the map for the selected year and RCP scenario. The selected RCP and year are shown in the ‘suitability projections’ tool panel. You can choose a different RCP by clicking the new one, and a different year, from 2015 to 2085 in ten year increments, by dragging the scroll handle left or right.
Vetting Mode
Edgar’s modelling starts by working out which aspects of the climate a bird is sensitive to. Edgar uses bird observations to determine where the species lives, and then examines the climate in those areas. This means having good observation records is important to get accurate modelling results.
Edgar’s set of bird observations comes from the aggregated data of the Atlas of Living Australia. The Atlas contains data from many sources and vintages, including observations that are inaccurate in either species identification or geographic position.
In addition to the outright accuracy of observations, Edgar should include only observations of a bird surviving and thriving in the wild. An observation of a cassowary in a zoo enclosure in Darwin is technically accurate, but does not help to identify Darwin’s climate as suitable for cassowaries.
If you are inclined to help the Edgar project and have some knowledge of the ranges of particular birds, you can help classify observations – and please do! It’s easier than it sounds.
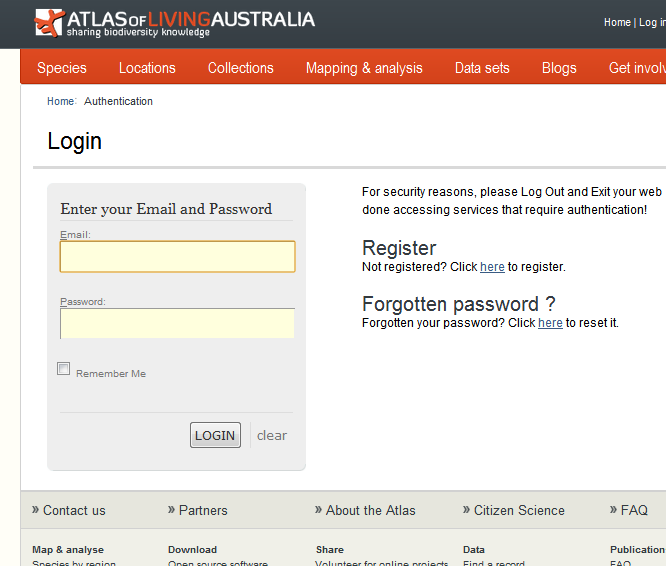
Step 1: obtain a login and password from ALA
Before you can vet records in Edgar, you need an ALA account, obtainable from the ALA ‘Create your account’ page, or simply clicking Edgar’s ‘Log In’ button and following the registration instructions.
Step 2: log in to Edgar
Edgar’s ‘Log In’ button in in the top right corner of the site. This takes you to an ALA login page, where you can enter your ALA account details. Choose ‘Remember Me’ if you want your web browser to remember your login for a while.
Step 3: select species and switch to Vetting Mode
Use the species bar to select the species you are interested in, which will automatically land you in Current Mode. Switch to Vetting Mode with the ‘Vet this species’ button.
Step 4: select observations
Now you have chosen a species, the rest of the vetting process is about choosing a group of observations, and applying your opinion about the proper classification for those observations.
To do this you use the ‘vet observations’ tool, which is so important that it gets its own screenshot.
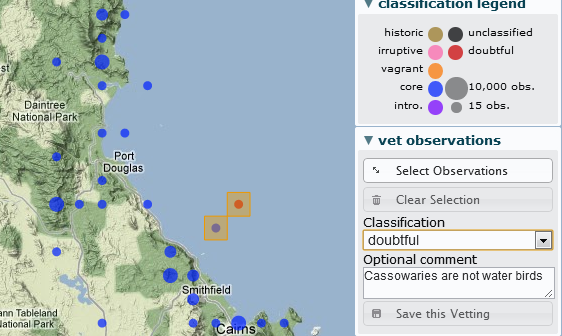
The Select Observations button changes what happens when you click-and-drag on the map. Normally, this button is “off”, and clicking-and-dragging on the map moves the map around.
If you switch the Select Observations button to “on”, then clicking-and-dragging the map doesn’t move the map around; instead it draws a selection box.
Draw a selection box around a group of observations to select them. Selected cluster dots will be highlighted in green1. You can select more observations by dragging over additional areas.
Click the Select Observations “off” again to switch back to dragging the map around. You can switch between dragging and selecting as often as you like.
The Clear Selection button will UN-select all the currently selected observations. If you mess up by selecting more than you intended, use the Clear Selection button and start over.
Step 5: classify observations
Once you have selected the observations you want to set the classification for, choose your preferred option from the Classification drop-down. If you like, you can type a comment into the Optional comment text box.
Step 6: save your classification
Finally, having chosen the correct classification for your selected observations, click the Save this Vetting button to commit your opinion to be recorded in Edgar’s database (and to be subsequently passed on to ALA).
Thanks for your contribution! You can vet further by returning to step 4 to classify more observations for this species, or step 3 to vet another species.
As part of Edgar’s modelling process, the most likely classification for each observation is determined by collating range maps supplied by BirdLife Australia and vetting contributions by users like you. Once your vetting is saved, the speices will be queued for modelling, and the effect of your vetting will show up once the modelling is complete.
-
The highlight is orange, in the screenshot. I took that before we realised that we already used orange for the vagrant classification. When you do it, the highlight will be green.
↩